Learning Data You Can Actually Use: Three Keys for Actionable Learner Analytics
Is it just us, or does it seem like technology has given us the ability to measure just about everything? For example, did you know that ninety percent of the all data in the world today has been created in the last two years alone. Everything we do online – from Google searches to Facebook posts to online purchases – produces data.
That’s why industry leaders like Amazon, Netflix and Facebook have teams of data scientists on staff. These expert scientists interpret user data and provide recommendations to create more efficient processes, engage with customers more fully and design better performing products. For example, in a famous UPS case, the carrier’s process management team leveraged data from its proprietary routing software to identify and eliminate wasteful driving practices that were impacting the company’s bottom line. By using data to identify and remediate inefficiencies like left turns and long routes, UPS was able to save $300 to $400 million annually in fuel, wages and vehicle running costs.
When we look at L&D, we see the same opportunities for data application. Today’s top learning technologies can capture and catalogue more learner data than ever before. They measure and report every click, every pause and every answer choice. Companies can use this learning data to make better business predictions, forestall errors and boost workforce morale. But often L&D departments don’t have a data scientist on hand to interpret large quantities of learner data and provide actionable suggestions. In fact, in our customer interactions, we’ve found that while “a lot” of data is an attractive idea, in reality L&D departments don’t have the personnel or resources to analyze vast reams of learner metrics.
So how can an L&D department make sure that their learning data is actionable? Here are a few things that make learning data more actionable.
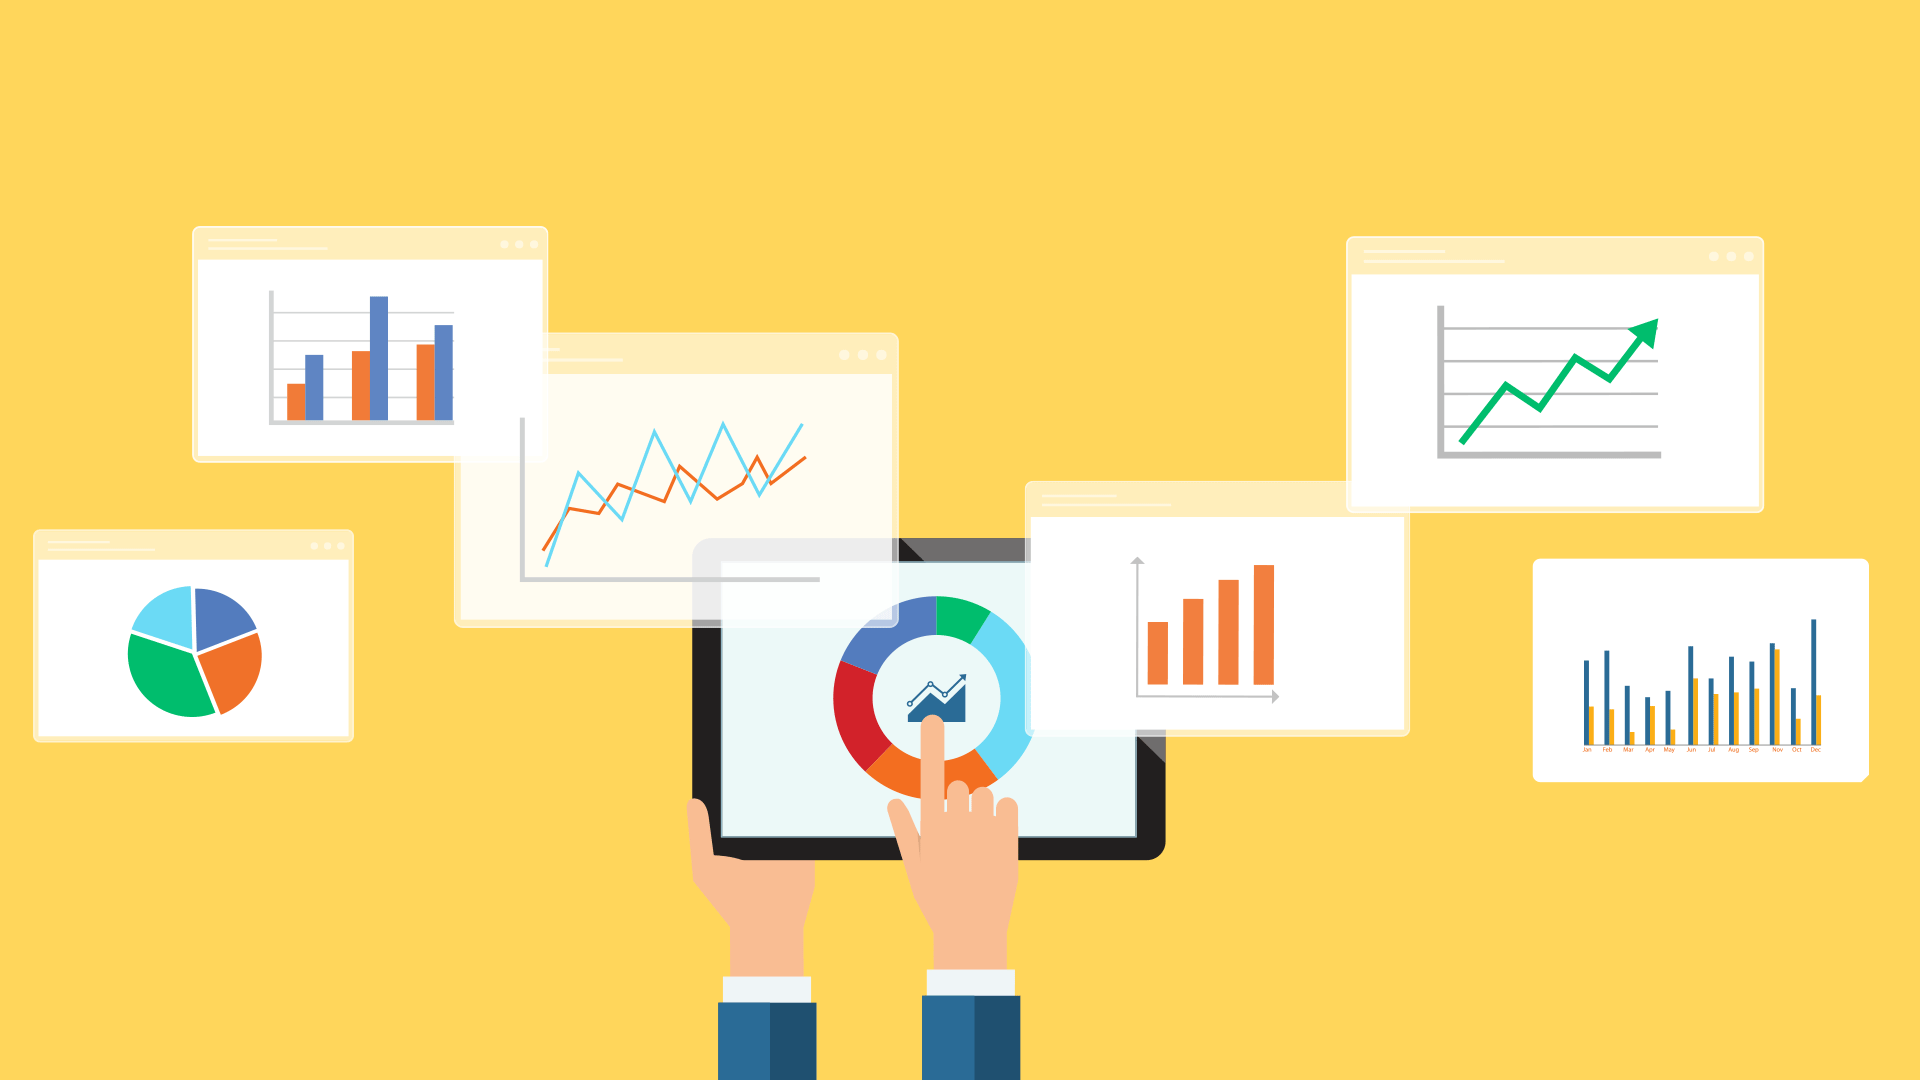
1.Clean, Clear Display – Looks matter. It’s nice to view a well-designed report. But, more importantly, the way data is presented can make it more or less actionable. For example, dashboards full of complex or “proprietary” terms, lots of raw data points, or seemingly contradictory information make it difficult for L&D to formulate a clear read-out, let alone make valuable recommendations from the data.
In contrast, streamlined dashboards that show the most pertinent information at the fore – things like how learners are performing, where they are falling short and why they’re experiencing difficulty – make for much more actionable tools. L&D professionals can use these to quickly determine where learners need additional remediation, which learners are succeeding/failing, and so on. These dashboards are also easier to share internally because they clearly demonstrate outcomes and require little explanation. (Aka: you don’t have to be a data scientist to interpret them.)
2.Recommendations and Suggestions – Imagine this: you take your car to a mechanic because it’s making a funny sound. The mechanic tells you what’s making the sound, but he doesn’t tell you how to fix it. He simply sends you on your way. Now you know what’s wrong with your car, but have no idea how to correct it.
Learning analytics that only provide data but don’t offer any subsequent recommendations or suggestions are just like the mechanic above. It’s nice to have an understanding of what’s going on under the hood. But, it’s equally important to have a plan of action to get the car up and running.
L&D departments don’t just need a read out of learner data, they also need some data-based suggestions to help them improve their content and evaluate their programs. For example, learning technologies with advanced analytics don’t just say, “learners consistently answered this question incorrectly;” they say “this question may be too difficult, here are some ways it can be improved.” L&D departments can use these suggestions to “fix the car” – not only improving content, but also informing coaching and remediation efforts and future learning programs.
3.Predictions for the Future – Predictive analytics are like the ghost of Christmas future – showing L&D what’s to come if they continue along the same path and giving them opportunities to make changes that will alter the final outcome.
Learning technologies with strong analytics capabilities leverage machine learning to provide predictions about things like:
- Where learners will fail,
- Who won’t be able to apply the training back on the job,
- Who’s destined to be a high performer,
- When learners will begin to forget the training, and so on.
These predictions are actionable outputs of learning data. Armed with this data, L&D is better equipped to intervene and apply specific practices to address predicted outcomes.
L&D needs learner data to be presented in an easy-to-interpret way that makes it simpler to formulate insights, apply findings and transform their workforce.
These are just three of the data capabilities that help transform learner data from static readouts to actionable insights. If you’re ready to learn more about how Fulcrum Labs delivers actionable learner data, check out our other relevant articles to learn more our innovative approach.
